The conversation around financial inclusion is still new in Pakistan’s mainstream. Within the policy circle jerks, it’s a hot topic though — one that gets you speaker slots and grants from donors. Unfortunately, it continues to be discussed in broad terms, for the most part, where the lens is typically limited to the national aggregates.
For a country as large and diverse as Pakistan, such an approach leaves us oblivious to the regional disparities. Understanding those differences is critical to meaningfully changing things and improving access to financial services. Plus, simply using headline numbers for accounts or transactions may have worked five years ago but offers little value today. Luckily, there is enough data for us to at least initiate the conversation.
Demand-side data
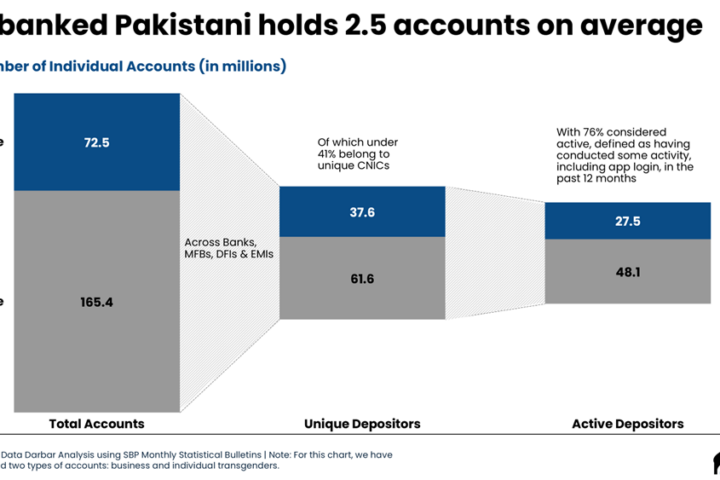
Let’s start with the Karandaaz Financial Inclusion Survey of 2022, which gives a glimpse of what the differences look like. According to the results, 30% of Pakistani adults — 47% males and 13% females — reported having an account with a formal institution.
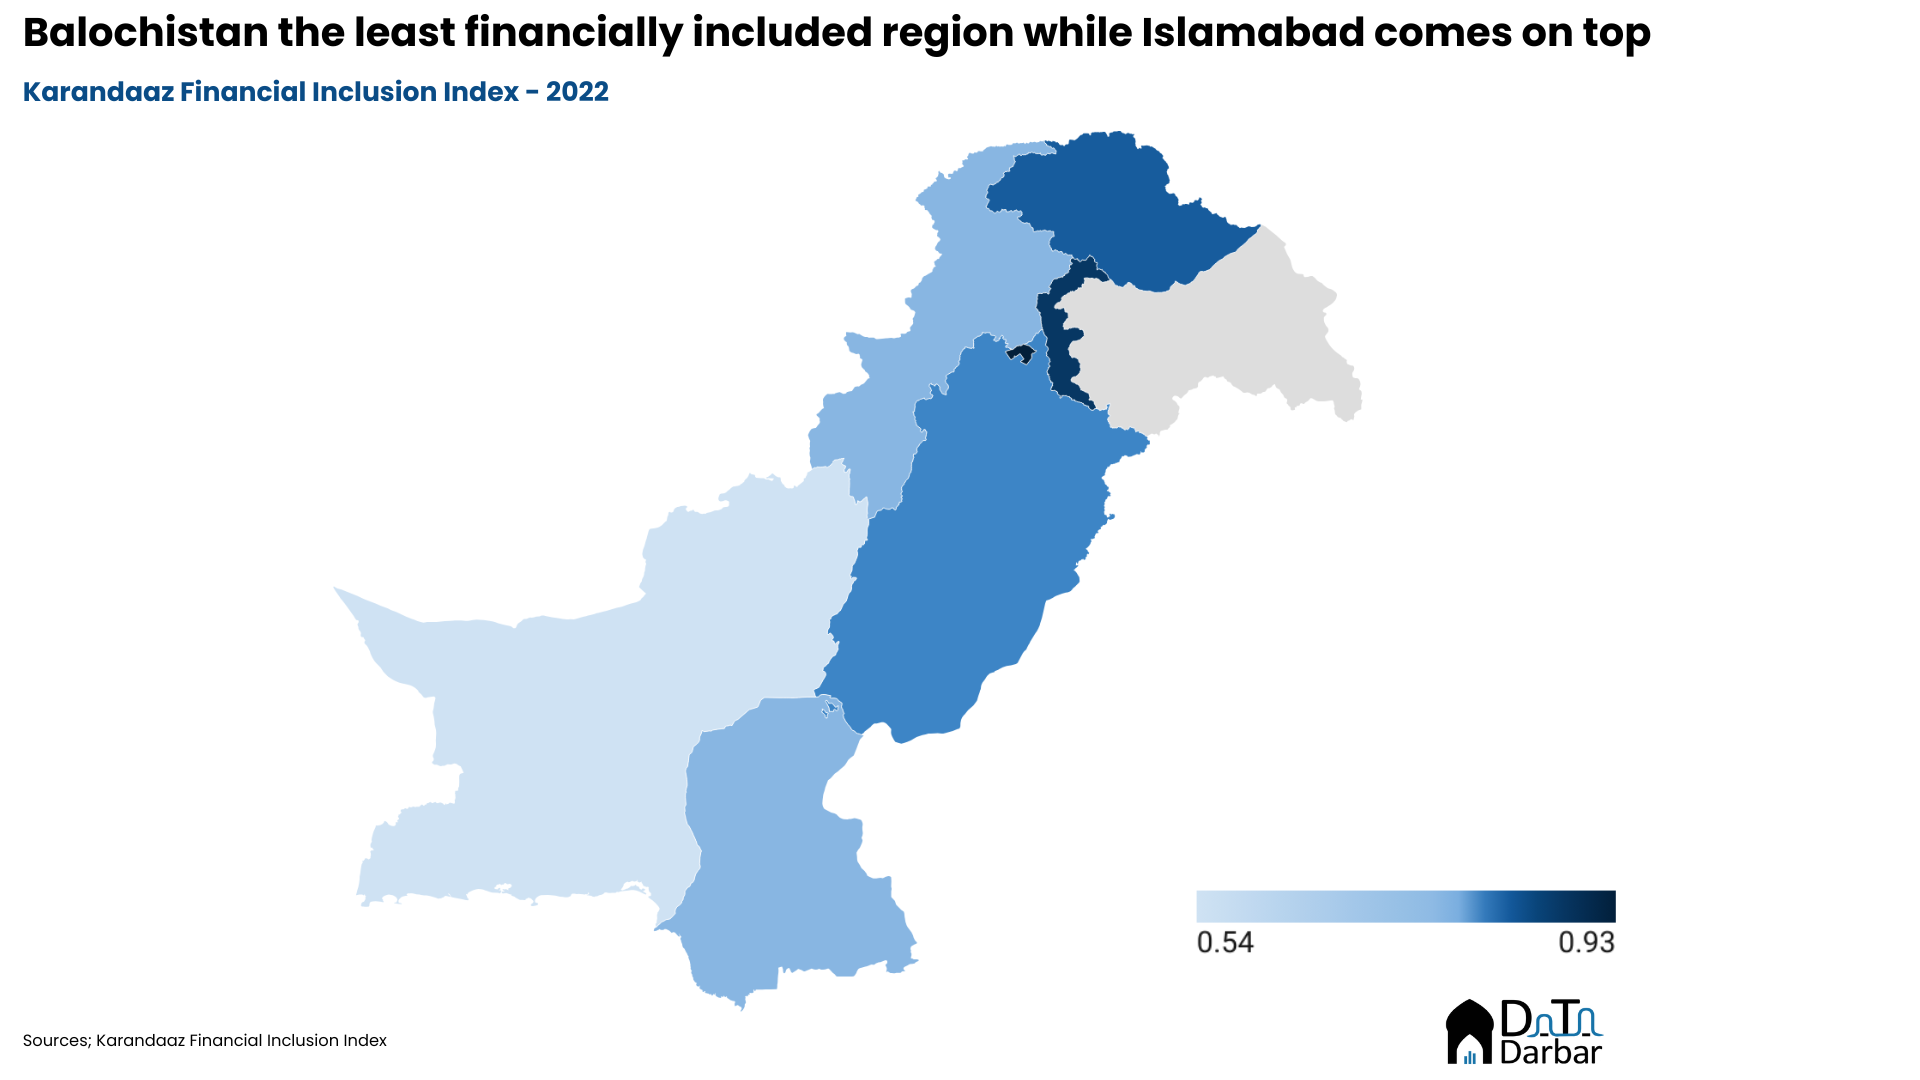
However, this isn’t evenly spread out as only 14% of the respondents from Balochistan had a registered financial institution account as compared to 45% from Islamabad. The corresponding figures for Punjab, Sindh, KP, AJK, and GB were 32%, 29%, 26%, 34%, and 35%, respectively. This means that Sindh and KP also lag behind the national average.
Using the survey data, Karandaaz built a composite index comprising six sub-indices: financial accounts registration, access points, underserved markets, capabilities, diversified usage, and trust levels. Here again, Islamabad comes out on top with a score of 0.93 out of 1, well above the national average of 0.77, while Balochistan is miles behind at 0.54. Unsurprisingly, this is quite a recurring feature where the province consistently underperforms across every dimension.
Karandaaz’s index uses the results from their own survey, which can face issues like representativeness or bias. To get a better sense of the picture, it’d also be worth looking at the supply-side statistics, which arguably give a better perspective since the data is spread over years.
Disparities in Branch Access
In the last two decades, Pakistan’s banking infrastructure has improved significantly with total scheduled bank branches increasing from 7,049 in 2004 to reach 16,678 by March 2024 while the corresponding number for microfinance was 1,463. This means there are 12.4 bank branches per 100,000 adults, only slightly lower than other developing markets. But beneath these headline numbers lie stark differences across provincial lines, where the rural-urban split further amplifies the gap.
Expectedly, Punjab leads by a mile at 9,714 scheduled and microfinance branches while Sindh is a distant second at 4,171, where Karachi alone accounts for almost 61% of the total. However, relying on absolute values is probably not the best idea and it’s important to contextualize the numbers with respect to populations.
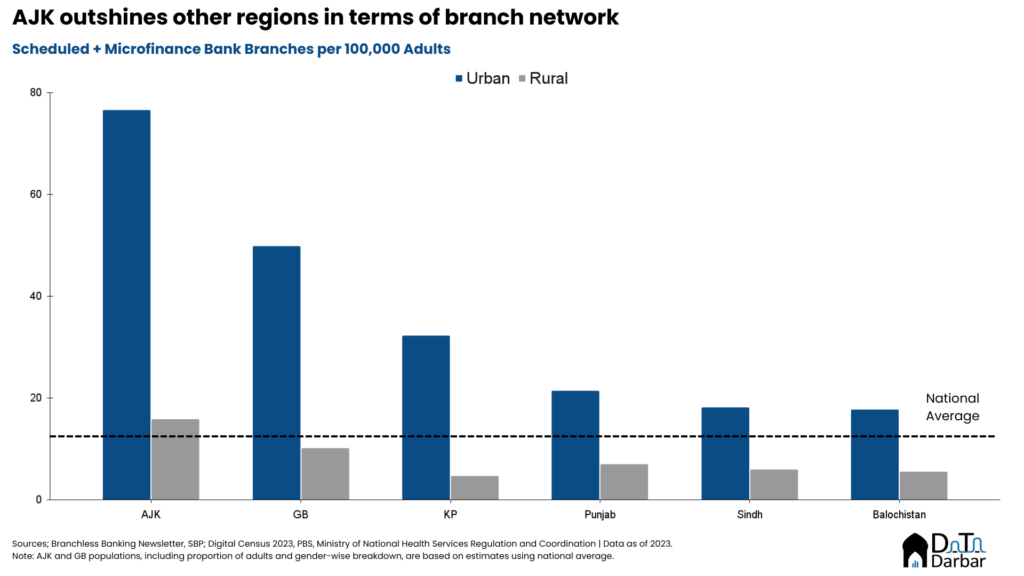
The differences are quite big with only 6.4 branches per 100,000 rural adults while the corresponding figure for urban is 21.3. Azad Jammu & Kashmir outshines in this regard, where its ratio for even rural branches beats the overall national average. Gilgit Baltistan also does well, helped by a low proportion of the urban population. On the other end, Sindh and Balochistan lag in both metrics.
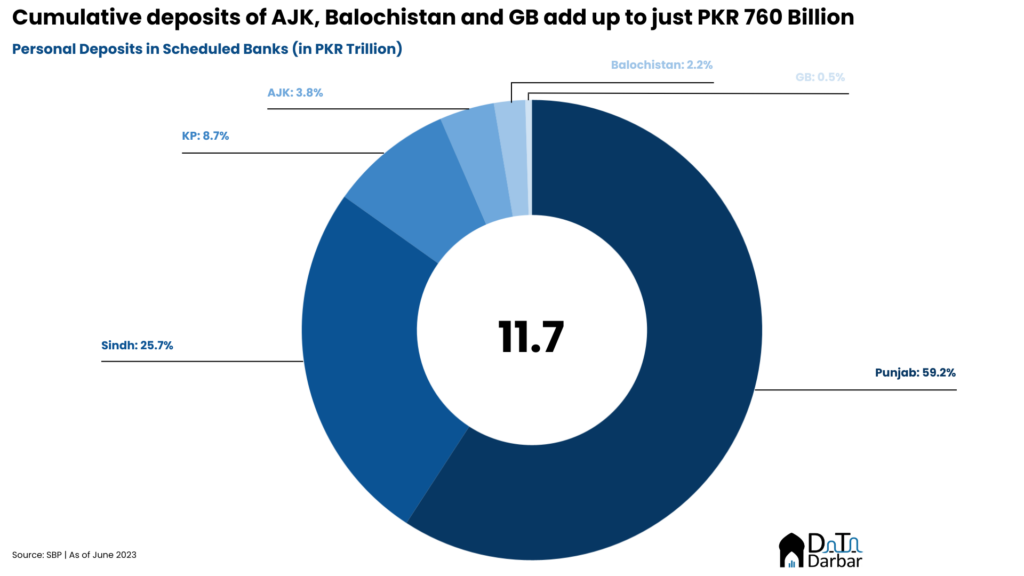
This access to bank branches, microfinance or otherwise, also partly explains (personal) deposit mobilization where Punjab accounts for 52.8%, or PKR 6.2T, of the national total. If you add Islamabad to the mix, its share increases further to 59.2%. In line with expectations, Sindh comes in second at 25.7% while KP follows behind at 8.7%. Sindh’s share improves to 30.8% if you include all other categories, such as the private sector, where Karachi’s position as a business hub helps attract high deposits from non-personal sources.
Punjab dominates in branchless access
Historically, most of the gains made by Pakistan in improving financial inclusion haven’t come from traditional banks but rather branchless banking, first through agent networks and eventually mobile wallets. This provides us with an even better lens to gauge where things stand as there exists data on not only the infrastructure but also accounts access and usage.
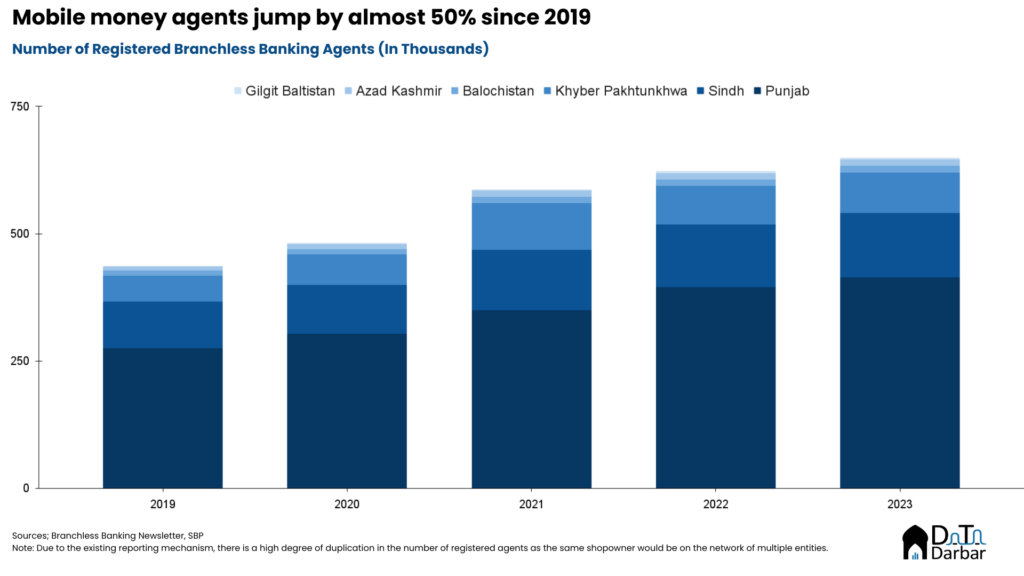
By sheer scale, it’s a no-brainer that Punjab leads with 413,991 branchless agents as of December 2023. However, a deeper look shows that the province’s share in the national total has increased to 63.72%, from 62.99% in 2019. This is not only higher than its proportion of the population but also that of bank branches — and continues to increase steadily. On the flip side, Sindh and Balochistan’s contribution is fledgling. In relative terms, this means Punjab has 516 registered mobile money agents per 100,000 adults, 2.74x of Balochistan.
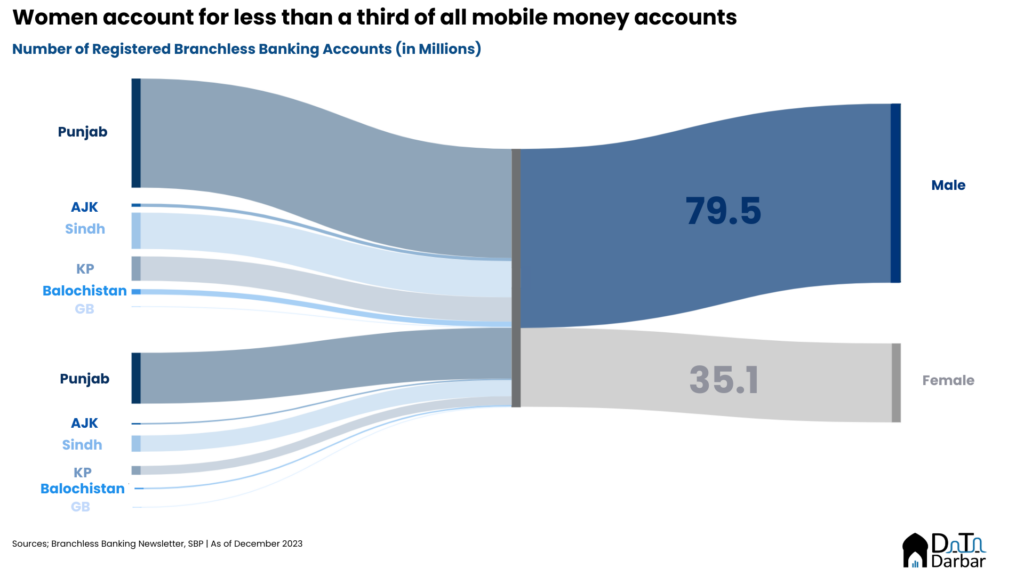
In terms of access, Balochistan has picked up some momentum of late as the number of registered accounts reached almost 3M by 2023. This puts the province’s share at 2.6%, up from 1.95% compared to the end of 2019 — boasting the second-highest five-year compound annual growth rate of 27.1%, and trailing only behind Gilgit Baltistan’s 27.5%. Underneath the numbers lie big gender disparity though, which is the most pronounced in AJK.
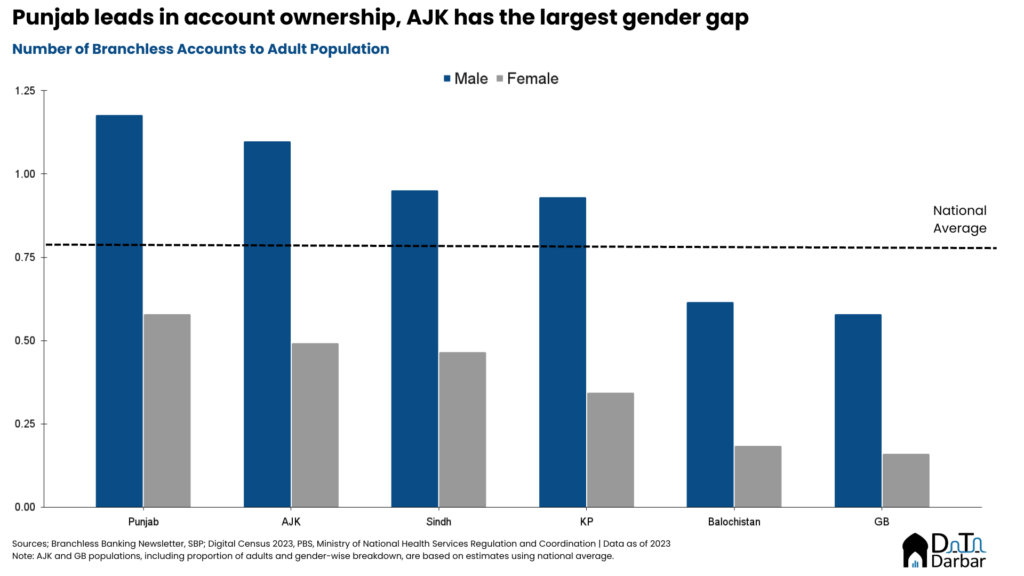
Relative to population, Punjab stands out with 1.18 branchless accounts per adult male and 0.58 for females — ahead of all other regions in both metrics. On the other end of the spectrum lies Gilgit Baltistan with only 58% of the adult men and 16% women having a mobile wallet account.
Regional Imbalances in Financial Inclusion
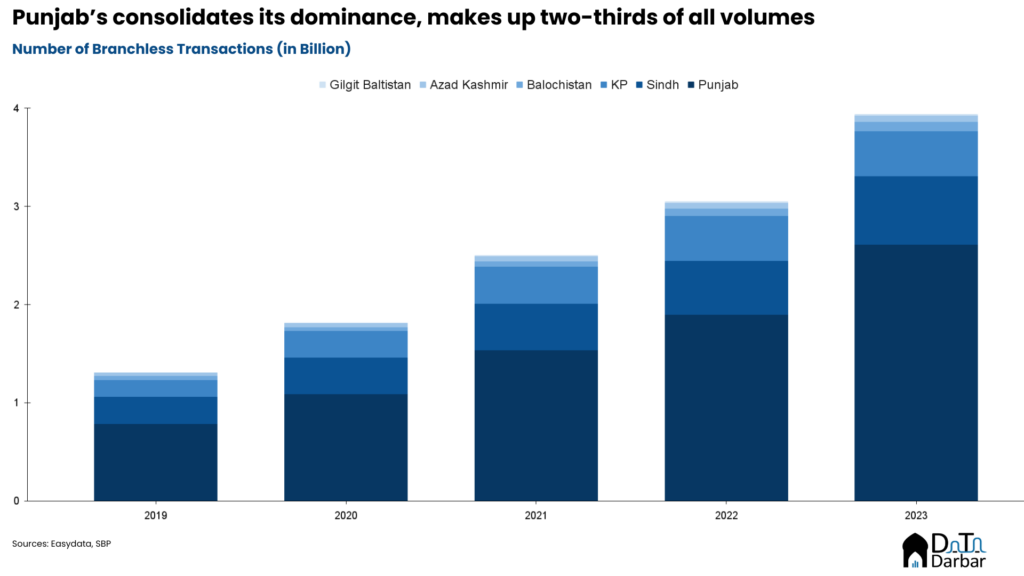
Access doesn’t necessarily equate adoption though, as policymakers and financial institutions have come to learn the hard way. By adoption, Punjab leads once again with 2.61 billion transactions out of a total of 3.94B in 2023 — making up 66.31% of the national aggregate. In other words, it accounts for a bigger piece of the pie even relative to agent networks or account ownership. Put another way, it accounts for a bigger piece of the pie even relative to agent networks or account ownership.
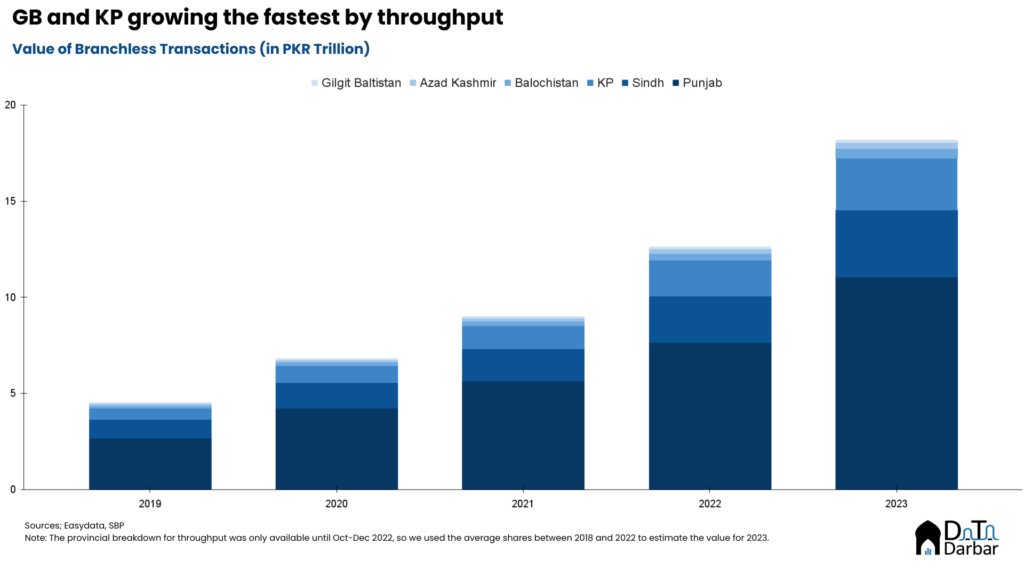
Not only that, Punjab also happens to be the fastest growing market, increasing at a five-year CAGR of 27.2%. This is 455 basis points higher than the second-place contender, Gilgit Baltistan, where the low base plays a major role. By throughput, Pakistan’s largest province had a 60.8% share or PKR 11.06T. Sindh was far behind at PKR 3.47T, followed by KP at Rs 2.7T.
The numbers paint a clear picture of the stark regional disparities across Pakistan. Hardly anything here is surprising: Balochistan, for far too long, has been ignored by everyone while Punjab relatively stands out, not just in financial inclusion. Needless to say, this needs to change and for that, the first step could be reporting the relevant data. Currently, we don’t even have an official breakdown of provincial GDP, let alone visibility at the city level. How would we then know where things are improving and what areas are being left behind? The other option is actually listening to people’s grievances but that’s far more unlikely to happen.